Table of Contents
General information
Geographers face a series of challenges when constructing maps for general use. These include:
- Displaying as accurately as possible a three dimensional object (ie the earth) on a two dimensional sheet in a manner which is useful;
- Accounting for an earth which, though generally an oblate spheroid in shape, is irregular;
- Devising a reference system which indicates height and depth to resonable accuracy; and
- Devising a geolocation system which allows map users to identify where on the earth’s surface they are currently located, the direction from which they’ve come, and the shortest route available to their destination.
These four requirements are conventionally addressed by employing projections (of which the best known and most widely used is the Mercator projection), an earth gravitational model (or geoid such as the earth gravitational model – EGM), a world magnetic model (WMM) and a coordinate system such as Universal Transverse Mercator (UTM).
Users of British maps are well served by the Ordnance Survey who publish the excellent Guide to Co-ordinate Systems in Great Britain.
Italian maps
Many of the walking maps available for Italy are produced by the Istituto Geografico Militare (IGM) whose HQ is located in Florence. They are generally based on 1940s data and use the Gauss-Boaga projection which has a number of unique (and uniquely confusing) features including:
- The projection is based on the Roma 1940 datum whose origin lies at Monte Mario near Rome;
- The maps show the zero longitude meridian passing through the Monte Mario datum.
- There are two zones – Zone 1 (West of 12deg East longitude) and Zone 2 (East of 12deg East longitude).
In practice this means that one must add 12deg 27mins 8secs to the longitude indicated on the map in order to obtain an Easting that accords with the current WGS datum. A slight, but not normally significant, adjustment has also to be made to the latitude. All this is a right pain.
The more modern maps are advertised as “GPS compatible”. What this means is that they use the WGS84 spatial reference system, details of which are given in the following section.
WGS84, UTM and all that
WGS84 stands for World Geodetic System 1984 and comprises four different things:
- an ellipsoid
- a horizontal datum
- a vertical datum
- a coordinate system
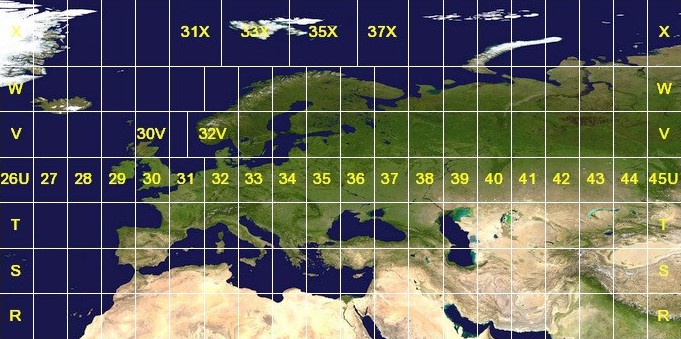
WGS84 is associated with the Universal Transverse Mercator (UTM) projection which uses a two dimensional Cartesian coordinate system to give locations on the surface of the Earth. It works as follows:
- The globe is divided into 60 North and South zones, each spanning 6deg of longitude;
- Each zone has its own central meridian;
- Zones 1N and 1S start at 180deg W;
- The limits of each zone are 84deg N and 80deg S with the division between North and South zones occurring at the equator;
- The polar regions use the separate Universal Polar Stereographic coordinate system;
- The origin of each zone is the central meridian and the equator;
- To eliminate negative coordinates, the coordinate system alters coordinate values at the origin. The value given to the central meridian is the false easting, and the value assigned to the equator is the false northing. The false easting is 500km, zones North of the equator are given a false northing of zero, and zones South of the equator are given a false northing of 10,000km.
- Each zone is divided into blocks and each block is given a reference letter (A, B, C etc). The most Southerly block is “A” and the most Northerly “Z”.
A full explanation can be found on the Florida Adventuring YouTube channel.
Interpreting UTM coordinates
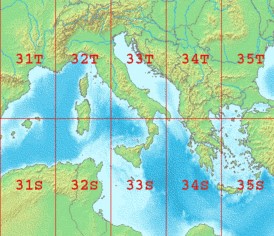
Let’s say that you’ve been given coordinates 33T E381554 N4700175 (Corno Grande in the Gran Sasso mountain range as it happens). The 33T indicates that the point of interest is within the 33rd 6deg secant at block T (ie East central Italy). The Easting indicates that Corno Grande is 500,000 – 381,554 = 118,446m to the West of the centre line of block 33T. Interpretation of the Northing is more straightforward as there is no false origin – Corno Grande is simply 4,700,175m North of the equator.
Difference between raster and vector maps
Vector data consists of individual points, which (for 2D data) are stored as pairs of (x, y) co-ordinates. The points may be joined in a particular order to create lines, or joined into closed rings to create polygons, but all vector data fundamentally consists of lists of co-ordinates that define vertices, together with rules to determine whether and how those vertices are joined. All Garmin IMG files are in vector format.
Raster data is made up of pixels (or cells), and each pixel has an associated value. Simplifying slightly, a digital photograph is an example of a raster dataset where each pixel value corresponds to a particular colour. In GIS (Geographic Information Systems), the pixel values may represent elevation above sea level, or chemical concentrations, rainfall etc. The key point is that all of this data is represented as a grid of (usually square) cells. The difference between a digital elevation model (DEM) in GIS and a digital photograph is that the DEM includes additional information describing where the edges of the image are located in the real world, together with how big each cell is on the ground. This means that your GIS can position your raster images (DEM, hillshade, slope map etc.) correctly relative to one another, and this allows you to build up your map. All KMZ custom maps and Garmin BirdsEye JNX files are in raster format.
KMZ files can contain vector or raster data, though only raster data are recognised as Garmin custom maps. (KMZ stands for Keyhole Markup language Zipped – a compressed version of a KML (Keyhole Markup Language) file. Keyhole was the founding company of the Earth Viewer software that Google Earth was built upon).
Still confused? Have a look at this video and all may become clearer.