
For those interested in the full demographic profile of the Lunigiana a detailed analysis is available on the AdminStat Italia web site.
Table of Contents
Family & age distribution
Massa-Carrara is charcterised by a declining, ageing population coupled with a low birth rate and a modest level of immigration.
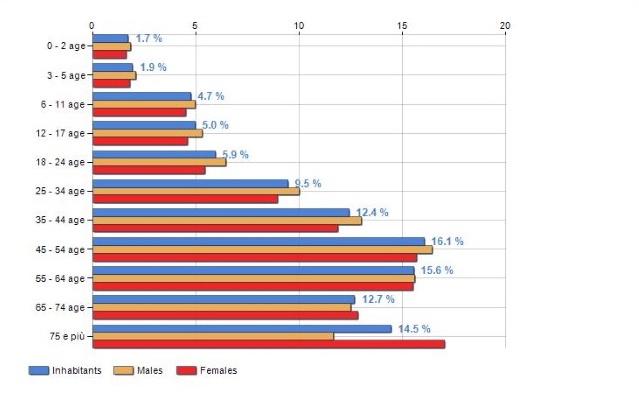
A summary of the characteristics of the area as at 1 January 2019 follows:
- Total population 195,048
- Life expectancy at birth: Males 81.3, Females 85.2
- Birth rate/1000 population 5, death rate 13.1
- Mean age of childbearing: 32. Fertility rate 1.02/family (all Italy: 1.27).
- Average age in 2019 was 48.4yrs (all Italy: 45.5). This is the 11th highest in the 107 Provinces. The corresponding figure for the UK: 40.1 (source: ONS).
- 42% of the population were over 55 years old
- Ageing index: 243 (174 for Italy as a whole)
- 51% of the population were single/widowed/divorced
- There were 89,005 families, the average component being 2.19
Source: I.Stat
Economy
Detailed data may be found on the 8milaCensus web site.
A summary (based on the year 2011 unless otherwise stated) for the province of Massa-Carrara is presented below:
- People in work: 43% (average for Italy 45%)
- People with higher education qualifications: 58.7% (average for Italy 55.1%)
- People living below the poverty line: 3.4% (average for Italy 3%)
- Average income per person in 2015 was 13,890 euro, the lowest of any of the ten provinces of Tuscany (details here)
- Over the period 1991-2011 the number of young adults living alone rose threefold from 2% to 6%.
Overall, the Lunigiana is about average in its economic characteristics compared with Italy as a whole.
Labour force participation
Italy has the third lowest birth rate in Europe after Malta and Spain. Some commentators put this down to the competing pressures placed on women – on the one hand they are expected to cook, clean and maintain the household with little help from their male partners, and on the other they feel the need to go out to work to maintain their standard of living which since 2001 has increased by a mere 2% (UK=18%). Reconciling these needs and expectations with child rearing has been viewed by many as unrealistic, especially as state support for working mothers (notably those with young children) is poor.
In 2022, the labour force participation rate (defined as the proportion of the population aged 15 and older that is economically active) was 41% among females and 58.4% among males. The corresponding figures for the UK were 58.5% among females and 66.3% among males.
Unemployment in Italy is currently (Nov 2023) 7.5% (UK=4.2%).
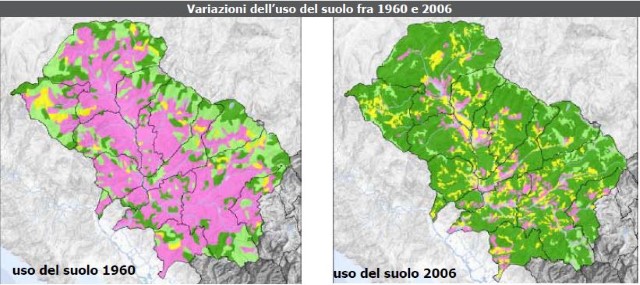
Land use
Until relatively recent times a high percentage of the population was engaged in agricultural production either on a full-time or part-time basis. However, since the 1960s there has been a radical change and now agricultural production is a marginal activity in the area. Nothing makes this clearer than the maps given below in which pink indicates land under cultivation and green indicates woodland.
Further information can be obtained from the Tuscan regional government website.
Residential property
Since 2008 the home ownership rate among the resident population of Italy has remained stable at between 72 and 74 percent. In 2021, approximately 73.7% of Italians lived in an owner-occupied household. For comparison, the proportion of owner-occupied households in the UK has decreased from 70.6 percent in 2000 to 64.3% in 2022.
The real residential property price index for Italy as at Q2 2023 was 71.72 (2010=100). On the same basis, the index for the UK was 114.17. Hence, on average, anyone who purchased a house in Italy in 2010 has seen its value decline by nearly a third over the last 13 years. Whether or not this trend will continue for long is anyone’s guess, but it’s inevitable that prices will level off at some stage. Although somewhat of an understatement, it’s fair to remark that (except in hotspots such as Milan and the Aosta Valley) Italian property does not currently represent an attractive investment opportunity.
In part, the different trajectories of house prices in Italy and the UK can be linked to population trends. For example, during the period 2010-21 the population of Italy declined from 59.28 to 59.11 million whilst that of the UK increased from 62.77 to 67.33 million. Population density might also be a contributing factor – that for Italy being 200/km2 as compared with 280/km2 for the UK.
Another point to ponder is that according to Scenari Immobiliari, 19% of housing sales in Italy relate to properties requiring remodelling or renovation. A comparable figure for the UK, as published by the Money website in its publication entitled “The Renovation Nation Report“, is less than 4%. Some suggest that since the production of brick, tiles, concrete blocks and cement is energy intensive (and energy costs have in recent years outstripped the general increase in prices) the amount Italians are prepared to pay for a house in real terms has on average declined.
Finally, it’s worth a mention that since 1981 the proportion of Italian properties classified as second homes/unoccupied dwellings has stabilised at between 20 and 23%. In comparison, the figure for England is approximately 5.9% (3.2% second homes/2.7% unoccupied). This oversupply of Italian housing stock (largely resulting from migration to urban areas in search of work) has inevitably had a negative effect on average prices. Based on 2005 data, the EU countries with the highest percentages of vacant dwellings are Greece (33.2%), Malta (27.6%), Spain (21.9%) and Italy (20.7%). When second and holiday homes are filtered out, the percentages for these countries go down to 11, 22, 15 and 8.3%, respectively.
Post-war migration from villages and rural areas to towns is one reason why in 2021, 54.9% of Italians were living in flats, maisonettes or apartments (England & Wales: 21.7%).
Non-Italian residents
As at 1 January 2022, 7.3% of the resident population in the province of Massa Carrara was non-Italian:
- 32% were Romanians
- 30% were of African origin
- 11% were Albanians
- 2% were UK citizens.
Source: tuttitalia.it
Crime
There are 107 provinces in Italy of which Massa-Carrara (which encompasses the greater part of the Lunigiana) is one. In terms of crime reports per 100,000 people, in 2019 the province ranked 19th at 4,180. For comparison, the number of crime reports per 100,000 people living in Milan was 7,017 – the worst in Italy. (The best rate of 1,493 related to Oristano, Puglia).
Burglary is by far and away the most frequent crime. Theft from the person and internet fraud are the second and third most common. Violent crime is very rare. Full details may be found on the Il Sole 24 Ore web site.
Healthcare
Italy’s healthcare system is consistently ranked among the best in the world. In 2000, a World Health Organization report listed it as the 2nd globally, after France. Life expectancy is the 4th highest among OECD countries (83.4 years in 2018) and the world’s 8th highest according to the WHO (82.8 years in 2018). Healthcare spending accounted for 9.2% of GDP in 2012, slightly lower than the OECD average of 9.3%. About 77% of the spending is public.
Healthcare is provided to all citizens and residents by a mixed public-private system. The public part is the national health service, Servizio Sanitario Nazionale (SSN), which is organized under the Ministry of Health and is administered on a regional basis.
Although Italy has had a national health service since 1978, there are stark differences in performance between regions. Marche, Molise and Basilicata offer particularly poor standards of care whilst Valle d’Aosta and Liguria offer some of the best.
Comprehensive healthcare statistics for Tuscany may readily be obtained from the Regione Toscana web site. Key elements relating to the province of Massa Carrara as reported in 2016 for 18-69 year olds (unless otherwise stated) are as follows:
- 29% of males and 26% of females smoke (UK 2018: 16% males & 12% females)
- 18% are considered at risk of alcohol related illness (21% of males & 14% of females)
- 28% are overweight and 9% are obese (UK 2018: 35% overweight, 28% obese)
- 20% are essentially sedentary, taking no meaningful exercise
- 30% of 14-19 year olds have taken narcotics (mainly cannabis)
- 42% of all age deaths are associated with diseases of the circulatory system, 26% with tumours and 7% with respiratory illnesses.